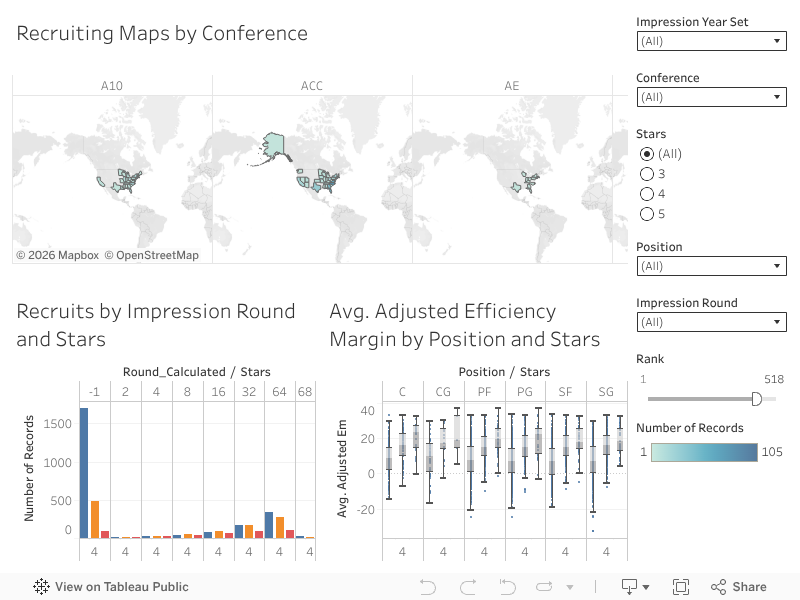
Tableau dashboards for graduate course in Data Visualization term project focusing on NCAA March Madness data.
var divElement = document.getElementById(‘viz1612047080917’); var vizElement = divElement.getElementsByTagName(‘object’)[0]; if ( divElement.offsetWidth > 800 ) { vizElement.style.width=’100%’;vizElement.style.height=(divElement.offsetWidth*0.75)+’px’;} else if ( divElement.offsetWidth > 500 ) { vizElement.style.width=’100%’;vizElement.style.height=(divElement.offsetWidth*0.75)+’px’;} else { vizElement.style.width=’100%’;vizElement.style.height=’1377px’;} var scriptElement = document.createElement(‘script’); scriptElement.src = ‘
https://public.tableau.com/javascripts/api/viz_v1.js’; vizElement.parentNode.insertBefore(scriptElement, vizElement);
Click here to view dashboard in Tableau.
var divElement = document.getElementById(‘viz1612047102017’); var vizElement = divElement.getElementsByTagName(‘object’)[0]; if ( divElement.offsetWidth > 800 ) { vizElement.style.width=’100%’;vizElement.style.height=(divElement.offsetWidth*0.75)+’px’;} else if ( divElement.offsetWidth > 500 ) { vizElement.style.width=’100%’;vizElement.style.height=(divElement.offsetWidth*0.75)+’px’;} else { vizElement.style.width=’100%’;vizElement.style.height=’1327px’;} var scriptElement = document.createElement(‘script’); scriptElement.src = ‘
https://public.tableau.com/javascripts/api/viz_v1.js’; vizElement.parentNode.insertBefore(scriptElement, vizElement);
Click here to view dashboard in Tableau.
Below you will find the abstract for the paper I wrote describing the project. Click here to view the paper on SlideShare.
Today there are 353 Division I college basketball teams, and each of them work hard just for a chance to be invited to the NCAA Division I Men’s Basketball tournament let alone win the national title. This paper builds on previous work analyzing NCAA tournament success and high school basketball recruiting. It is easy to find resources that explain what makes teams the best of the best in any given year, but it becomes harder when we attempt to understand teams outside of the top. Facilitated through data dashboards, we offer an interactable visualization system to drill down on important aspects that make up different college basketball teams. Our visualization system bridges the gap in previous work by helping teams understand what it takes to get to the next level rather than trying to jump to the very top over the course of one season.